On the fly deduplication of event reports from multiple sensors
This post is about the solution to a problem that I encountered a while ago when I was working on a project that I can’t discuss here. At the time when I came up with this solution I couldn’t find any literature on the subject. On one hand I wrote this to help out other people who face similar problems, on the other hand I’d be really happy if you could point me to some real literature on how to do something like this.
the problem
Assume an irregular, reoccurring event, which does not have any additional
properties like a location or a duration. It just happens at some point, as if
there was some failure rate attached to it.
We have a group of sensors and each of them can observe this event and report it
to a central base station, with a timestamp of when they think it happened, which will
be slightly inaccurate. Sometimes a sensor may fail to report an event and
sometimes a sensor may report an event even though there is none and there is
also a network delay from the sensors to the base station.
At the base station, we want keep an accurate count of the reported events
and the most accurate account of when we think that these events took place.
Meaning we have to merge reports from different sensors, which we believe to
represent the same event and assign this merged event a time of occurrence.
Those merged events have to be available as close to in real-time as possible,
because the base station also has to forward them along, at which point the reported
data is final and can’t be modified any more.
the proposed solution
We will now roughly outline the application code that is running on the base station in the simplest possible way, getting closer to the final solution with every step. I chose ruby for this because it’s a fairly readable language. You can find the complete source code for this on github.
recording incoming events
If a report arrives from a sensor we put it in a ruby array, which for
non-rubyists is just a list. Basically @received_reports is a list of
timestamps of events that were reported by the sensors.
def receive(report)
  @received_reports << report
end
measurement errors
Next we tackle the measurement error of the sensors, meaning the deviations
between the event times reported by the sensors and the actual event time.
We will not consider the on-the-fly aspect of the problem just yet.
We assume that this measurement error is characterized by a normal distribution
with some standard deviation, that signifies the average deviation from the actual
event time given one measurement. We will call that standard deviation our
@mean_time_error later. Since we need the probability density function for this
distribution, we look it up on Wikipedia and translate it to ruby.
def normal_PDF(mu, sigma, x)
    # this could be replaced by a lookup table if the inputs were discrete
    y = (1 / (sigma * ((2 * Math::PI) ** 0.5))) *
          (Math::E ** (-((x - mu) ** 2)) / (2 * (sigma ** 2)))
end
consolidating events
Now we leave the solid ground of tried and true mathematics and step into the
realm of ‘well Intuitively this makes sense’. We take all the events from our
@received_reports list and add up their probability density functions.
This is the formula to compute the value of that function for some x-value.
def sum_of_normal_PDFs(mu_list, sigma, x)

  sum = 0.0;
  for mu in mu_list
    sum += normal_PDF(mu, sigma, x)
  end

  sum
end
Next we will plot this function with [2, 4, 5] as our event list
and 1 as our @mean_time_error with x values ranging from
0 to 8.
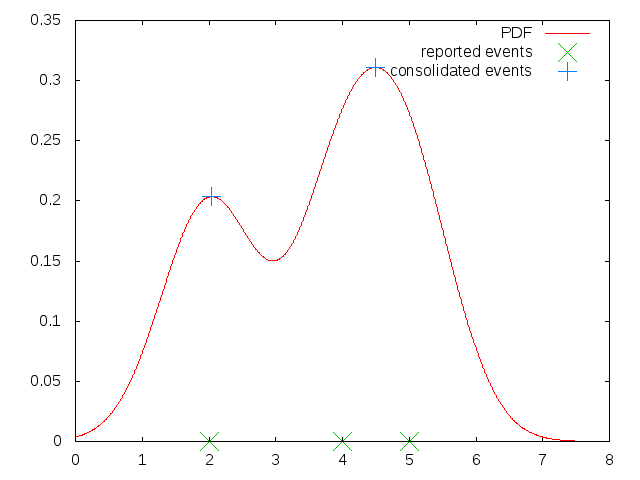
This plot also contains the three reported events from our example data. Notice that there are only two peaks in this data, marked in blue, because the event reports a time 4 and 5 were so close together that they produced one giant peak in the PDF instead of two. This is how we will produce our merged event data, we just take the local maxima in our function as our merged events.
eliminating false reports
To eliminate false positives we can set a minimum y-value for our
local minima to be considered as a merged event and call it
our @min_merge_peak.
If the peak lies below the @min_merge_peak value, we don’t
output a merged event for it. We don’t want to set this
value too high though, to avoid false negatives. Note that this
value depends on the @mean_time_error, because that value
determines what the peak of an individual bell curve is.
doing all of that on the fly
Now let’s finally turn this into a real time system and take care of
the network delay at the same time. We do this by using a small sliding window
of width three in which we can identify a local maximum by the fact that the
middle value is the highest one. As our program is running and we get reports of
events, we can move this window forward periodically. To ensure that we are not
working on incomplete data, that is still missing event reports this window does
not process the most currently available data, but data that lags behind the
current time @t by at least some fixed @delay which consists of the maximum
network delay andsome multiple of the @mean_time_error.
Let’s assume we use 3 * @mean_time_error. Intuitively this means that for
events reports that are not late by more than 3 * @mean_time_error, which
has a probability of only 0.135 % according to the
68-95-99.7 rule their corresponding peak will not have already
passed by as they slide into the time window and therefore will be interpreted
correctly. In the rare cases where an event falls outside of this margin,
It would produce an event with an incorrect timestamp. To prevent this
we choose to drop those events in the receive method.
def receive(report)
  unless report < @t - @delay then
    @received_reports << report
  end
end
To slide our window along in real-time we introduce a tick-function which gets
called periodically with a high enough frequency. The tick function advances the
sliding window by @time_inc, lagging behind by our @delay, and outputs a
merged event if the middle value in the sliding window is the maximum.
Additionally we remove events which have become too old to play a role in our
current calculations, so that our @received_reports list doesn’t get longer
and longer.
We use a Proc to report a merged event, you can find out about them
here.
def tick()
  # advance window
  @prev_y = @curr_y
  @curr_y = @next_y
  @next_y =  StatisticsUtils.sum_of_normal_PDFs @received_reports,
                                                @mean_time_error,
                                                @t + @time_inc - @delay
  # output events
  if @prev_y < @curr_y && @curr_y > @next_y && @curr_y > @min_merge_peak then
    @send_merged.call(@t - @delay)
  end
  # remove old reports from list
  @received_reports.reject! do |rep_time|
    rep_time < @t - @delay - 3 * @mean_time_error
  end

  # advance time
  @t = @t + @time_inc
end
future work
origin aware merging
If we can be sure that one sensor does not report an event twice we could think of some extension to this scheme that considers this fact and does not blend together events from the same sensor. I’m not sure how this would look though.
hierarchical systems
There is a nice symmetry here of the base stations and the sensors having basically the same interface. So instead of connecting everything to one base station we could arrange them in a tree structure.
replace sliding time window with clever mathematics
I’m pretty sure there must be some analytical way to find the peaks in our function without using a sliding window. This would make this method a lot more efficient, we could probably only do some calculation each time we receive new inputs and get rid of the tick function.
multidimensional
If we have some mathematical way of finding those peaks we could use other dimensions in addition to the time dimension as a criterion to merge events.